Kemp.rest / Examples / Designs / Radar
KEMP.REST / EXAMPLES / DESIGNS
Live AIS radar
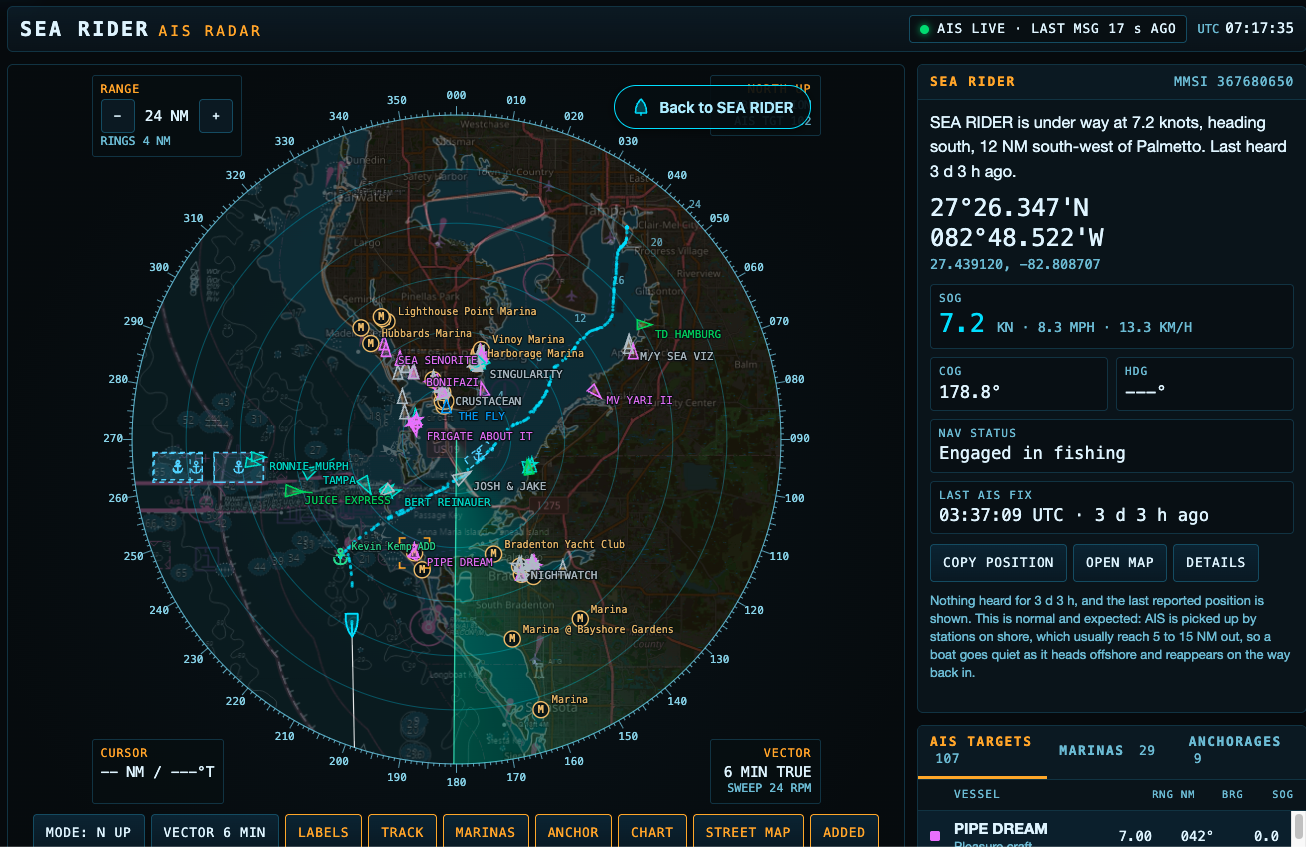
Written by Kevin Kemp for Offing: Following Seas. The screen is HTML, CSS, JavaScript, and a canvas, on the live page at presscare.com/offing. These frames are the display after the range is opened and the layer toggles and list tabs are used.
Technical report AIS code NOAA code OpenStreetMap code
The display
SEA RIDER, MMSI 367680650, at 24 nautical miles, panned toward the coast so the land and the harbours sit in the picture. The NOAA chart and the OpenStreetMap street map are both on. Marina names and anchorage marks are drawn on the same sweep as the AIS targets. The row under the scope is the layer control: mode, vector, labels, track, marinas, anchor, chart, street map, and added places.
The lists
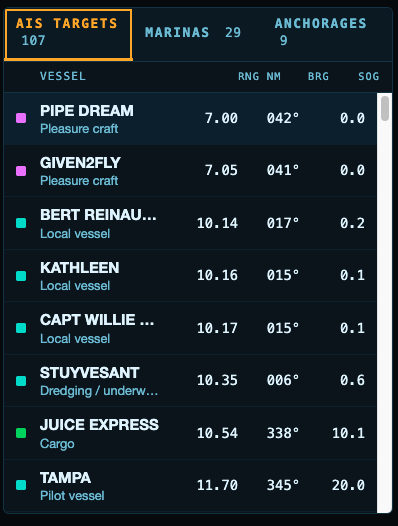
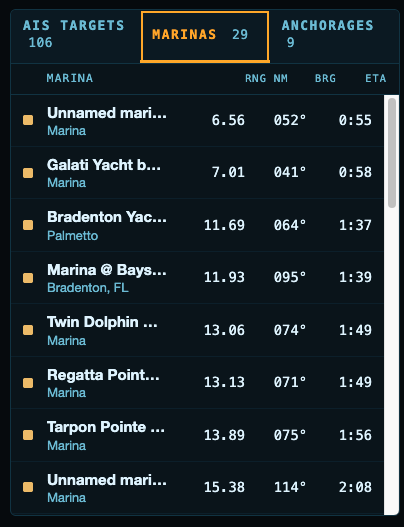
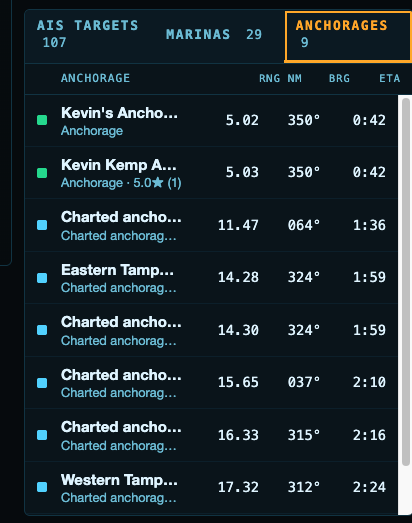
The same data is listed beside the scope. AIS targets, marinas, and anchorages are three tabs. Each row is range and bearing from the boat, and an ETA while the boat is moving. The marina rows are the OpenStreetMap import. The anchorage rows mix places added on the water with the charted NOAA areas.
What had to sit on one screen
- A plan-position display that stays centred on a moving boat, and can be dragged off that boat and brought back.
- A nautical chart and a street map, drawn under the sweep, each with its own toggle.
- Marina and anchorage marks that appear and disappear with the buttons, without reloading the page.
- Three lists that keep range, bearing, and ETA current from the same fix the canvas is using.
Where the picture comes from
- AIS positions arrive over a WebSocket and are drawn as the targets and the track.
- The NOAA chart is tiled into the canvas, and the charted anchorage areas are stored as rings.
- OpenStreetMap marinas and anchorages are imported into MySQL and listed here with range and bearing.